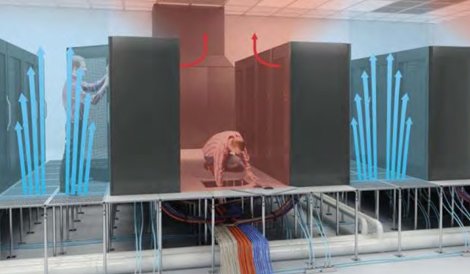
In most modeling programs servers are considered to draw a specific volume of air when they are on and no air when off. But when exposed to positive or negative static pressures that occur in hot-aisle or cold-aisle containment, how much do servers really leak?
Leakage will reduce the delta T over servers and result in cold air bypass into the hot aisle. This could theoretically be induced in two ways. A positive static pressure in a cold-aisle containment system would force air in excess of the designed flow rate through the machine. By the same token, a negative pressure in a hot aisle could result in cold air being pulled through the servers above the rated airflow. For this study, we will accept the theoretical model that servers do not leak.
Modern IT servers are typically designed for a zero-static pressure operation. But consider this scenario. A medium-size data center is equipped with ten cold-aisle containment systems. The data center is of recent build and uses EC fans to increase efficiency of CRAH units. The user has chosen to control the fan speed by using an array of static pressure sensors installed through the raised floor. This array is used to control all CRAH units in parallel. Ideally, this will allow the data center user to control the volume of air required by adding more or less airflow panels in the raised floor, and respond to the removal of solid panels for under floor service.
In our example, each cold-aisle containment system consists of 20 racks, 10 per row, with a maximum IT load projection of 16kW each. Like many data centers, IT load is variable in nature. In this example we will assume the idle load is 8kW, and a peak full utilization load of 16kW. The data center is configured to handle the peak load per rack of 16kW. The user has 20 airflow grates installed in each row. The static pressure below the floor is held at a constant 0.10” of H2O. Taking a look at the airflow characteristics of the grate, we find a nominal airflow at 0.10” of 2096 CFM. During idle times we use the assumed 8kW rack load, and 126 CFM/kW of airflow, thereby calculating that the IT equipment only requires 1008 CFM airflow.
What happens to the remaining airflow volume that could be delivered by the panel when the rack is not consuming maximum airflow volume? What is typically found is that the static pressure in the cold aisle must build to the point where it results in a differential pressure over the panel that results in the required flow. Since only 960 CFM is required per airflow panel, and a differential pressure of 0.02” across the panel is all that’s required to reach this flow rate, we can assume that the static pressure in this cold aisle will reach approximately 0.08” of H2O.
Consider a similar theoretical hot-aisle containment scenario. Everything in the assumption remains the same. The speed control for the fans is now handled by pressure sensing in the drop ceiling which serves as a return plenum. The designer is now attempting to ensure sufficient flow back to the CRAH units, so a negative static pressure of 0.10” is needed to move the volume of flow required. Let’s assume the net total open area of the return grills in the drop ceiling equals our cold-aisle containment configuration, and a similar, but negative, static pressure results in the same flow. With these assumptions the hot aisle in the partially loaded day-one configuration will be experiencing a negative static pressure of about 0.08”.
Airflow design vs reality
An observation of the internal design of an average server reveals two things. The typical server is full of various components, consisting normally of hard disks, main boards, memory, processors etc. What can be seen is that the overall internal design is optimized for airflow. Multiple fans are positioned to push or pull air over specific components, ensuring delivery to the inlet of the server reaches and all critical components. The acceptable temperature levels of some components are lower than others. IT servers – especially 1U form factor servers – are often serial airflow devices with air pulled over hard drives and passed to the processors, then the memory and power supplies. In many cases parallel paths are also created to ensure inlet temperature air reaches components at later stages where required. IT hardware designers heavily use CFD programs to determine the airflow paths and temperatures throughout machines to determine optimum quantity of fans and airflow directing devices, as well as the locations of key components.
After observing a number of server internal designs, in detail and in passing, it was decided that an airflow testing rig could be created to allow accurate metering of airflow through a server during operation at negative, zero and positive static pressures. The machine consists of an Energy Conservatory Duct Blaster Fan, designed to meter low airflow volumes through ducts. The fan system is capable of variable speed and can meter the static pressure contained within the airflow testing machine designed to simulate a contained cold or hot aisle.
Airflow testing
Servers are installed into the front of the airflow testing machine and two tests are run. The server is powered on and set to operate in an idle only mode. The airflow is then measured with the duct blaster fan set in the ‘off’ position. The server draws air from the airflow measurement machine, through the non-rotating fan. The fan’s airflow sensors detect the flow velocity and the controller – a DA-700 from the Energy Conservatory – takes this flow data from the opening of the fan. The same measurement device measures the differential pressure between the small contained aisles and the outside space. Once this measurement is noted for the server being tested, the fan speed is increased to result in a neutral differential pressure. The airflow value recorded is representative of the normal airflow values for the server in a typical non-contained hot aisle/cold aisle configuration. From this point, airflow values are recorded with increasing static pressures, from 0.02” to 0.20” of H2O.
We found that a small increase in static pressure in a cold aisle or a negative static pressure in a hot aisle would increase airflow through the servers by nearly 25% on average. Steadily increasing static pressures results in significantly higher flow rates, with the volume, on average, increasing by 50% by the time the static pressure reaches 0.05”. Based on the servers tested, we expect an airflow leakage of almost 400 CFM per rack in a standard 42U rack fully configured with IT hardware.
‘leaky’ server comparison
The theoretical model of a non-leaking server is incorrect. When static pressure in the cold aisle builds the servers themselves will bypass additional airflow when exposed to this differential static pressure. With a customer with a variable IT load between – 16kW (~2016 CFM) during peak consumption and 8kW during idle (~1008 CFM) – how much air can we expect to leak through an average server during idle states? Previously, with a 0.10” static pressure below the floor, the user could expect a cold aisle pressure of nearly 0.08”. We can see that an additional 69% more airflow could be expected to leak through the system. At 8kW or 1008 CFM we would expect to see an additional 700 CFM in leakage. This can be seen as an incomplete story since the total flow rate per rack increases due to server leakage, so the static pressure should fall in the aisle. To determine the true leakage, the balance point between static pressure and leakage must be found.
We can examine leakage data and the flow data from the servers to find a balance point. Let’s assume that due to leakage the static pressure falls to 0.06” in the cold aisle. This would result in a leakage flow of 564 CFM, resulting in a total flow of 1572 CFM. This would result in an airflow pressure differential between the floor and the cold aisle of 0.04”. We see that the flow rate for a Grate in this condition is 1320 CFM.
Since the server flow rate plus leakage is still higher, we haven’t found the correct stabilization pressure. Let’s compare the 0.05” static pressure values. We can expect 47.8% leakage over the neutral static pressure, or 481 CFM of leakage, for a total server flow of 1489 CFM. We can also see that the flow rate of the Grate when exposed to a 0.05” differential static pressure to be 1468. This would appear to be the true balance point of the real world cold-aisle containment in our example, taking into account the ‘leaky’ server reality.
‘Leaky’ server impact
Leaky servers do not allow for traditional airflow systems to compensate for the changes in static pressure that may be seen in the aisle containment system. In our model, over 46% of additional airflow will be delivered into the cold aisle during idle operations, which based on most data center research is a large majority of their operating lives.
Data center designers cannot ignore the peak draw that is expected during normal operations. Typical high efficient EC type fans, with which most data center air handling equipment is equipped, may have an energy usage of between 0.6 kW/kCFM and 0.24 kW/kCFM. Assuming a median value of approximately 0.42 kW/kCFM, each rack consumes approximately 200 watts of additional fan energy in our example. Our entire row is responsible for an additional 4kW of power consumption during idle conditions. Assuming that the system is 70% in idle mode, and 30% of the time at full load, an additional 24, 528 kWhr are consumed per year, at a cost of around $2500 assuming a $0.10 per kWhr. (4kW * 24 hours *365 days * 70% of the year * $0.10) This consumption in fan energy represents about 20% of the total fan energy cost to cool this single row. Eliminating this wasted airflow that is forced through the IT equipment would reduce the energy consumption at the CRAH unit fans by 20% immediately.
Based on our tests, server airflow leakage is a reality that must be considered when examining the potential operation efficiencies associated with aisle containment strategies. Servers will leak cold air into the hot air stream at a rate 23%-135% of their designed flow rate based on this study. This leakage has a real-world impact on the annual energy cost to operate a data center.
Data center energy reduction strategies, such as aisle containment, may be the next step in your data center environment. The results show that having a handle on airflow volume into the containment system will ensure reliable, efficient operation of the data center.