Hardware refresh is the process of replacing older, less efficient servers with newer, more efficient ones with more compute capacity.
However, there is a complication to the refresh cycle that is relatively recent: the slowing down of Moore’s law. There is still a very strong case for savings in energy when replacing servers that are up to nine years old. However, the case for refreshing more recent servers — say, up to three years old — may be far less clear, due to the stagnation witnessed in Moore’s law over the past few years.
Moore than meets the eye?
Moore’s law refers to the observation made by Gordon Moore (co-founder of Intel) that the transistor count on microchips would double every two years. This implied that transistors would become smaller and faster, while drawing less energy. Over time, the doubling in performance per watt was observed to happen around every year and a half.
It is this doubling in performance per watt that underpins the major opportunity for increasing compute capacity while increasing efficiency through hardware refresh. But in the past five years, it has been harder for Intel (and immediate rival AMD) to maintain the pace of improvement. This raises the question: Are we still seeing these gains from recent and forthcoming generation of central processing units (CPUs)? If not, the hardware refresh case will be undermined … and suppliers are unlikely to be making that point too loudly.
A performance plateau?
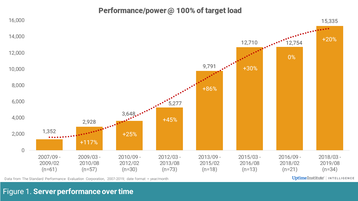
To answer this question, Uptime Institute Intelligence analyzed performance data from the Standard Performance Evaluation Corporation (SPEC; https://www.spec.org/). The SPECpower dataset used contains energy performance results from hundreds of servers, based on the SPECpower server energy performance benchmark. To be able to track trends and eliminate potential outlier bias in reported servers (eg, high-end servers versus volume servers), only dual-socket servers were considered in our analysis, for trend consistency. The dataset was then broken down into 18-month intervals (based on the published date of release of servers in SPECpower) and the performance averaged for each period. The results (server performance per watt) are shown in Figure 1, along with the trend line (polynomial, order 3).
The figure shows how performance increases have started to plateau, particularly over the past two periods. The data suggests upgrading a 2015 server in 2019 might provide only a 20 percent boost in processing power for the same number of watts. In contrast, upgrading a 2008/2009 server in 2012 might have given a boost of 200 percent to 300 percent.
Diminishing returns
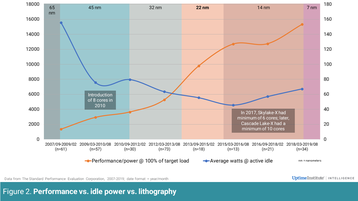
To further understand the reason behind this, we charted the way CPU technology (lithography) has evolved over time, along with performance and idle power consumption (see Figure 2).
Note: The color-coded vertical bars represent generations — lithography — of processor technology (usually, Intel). For each generation of around three to four years, hundreds of servers are released. The steeper the rise of the orange line (compute performance per watt), the better. For the blue line — power consumption at idle — the steeper the decline, the better.
Figure 2 reveals some interesting insights. During the beginning of the decade, the move from one CPU lithography to another, e.g., 65 nanometers (nm) to 45 nm, 45 nm to 32 nm, etc., presented major performance per watt gains (orange line), as well as substantial reduction in idle power consumption (blue line), thanks to the reduction in transistor size and voltage.
However, it is also interesting to see that the introduction of a larger number of cores to maintain performance gains produced a negative impact on idle power consumption. This can be seen briefly during the 45 nm lithography phase and very clearly in recent years with 14 nm.
Over the past few years, while lithography stagnated at 14 nm, the increase in performance per watt (when working with a full load) has been accompanied by a steady increase in idle power consumption (perhaps due to the increase in core count to achieve performance gains). This is one reason why the case for hardware refresh for more recent kit has become weaker: Servers in real-life deployments tend to spend a substantial part of their time in idle mode — 75 percent of the time, on average. As such, the increase in idle power may offset energy gains from performance.
This is an important point that will likely have escaped many buyers and operators: If a server spends a disproportionate amount of time in active idle mode — as is the case for most — the focus should be on active idle efficiency (e.g., choosing servers with lower core count) rather than just on higher server performance efficiency, while satisfying overall compute capacity requirements.
It is, of course, a constantly moving picture. The more recent introduction of the 7 nm lithography by AMD (Intel’s main competitor) should give Moore’s law a new lease of life for the next couple of years. However, it has become clear that we are starting to reach the limits of the existing approach to CPU design. Innovation and efficiency improvements will need to be based on new architectures, entirely new technologies and more energy-aware software design practices.
The full report Beyond PUE: Tackling IT’s wasted terawatts is available to members of the Uptime Institute Network here.
Find out more
-

Broadcast DCD>New York VIRTUAL (Spring edition)
-

-

-

-


