
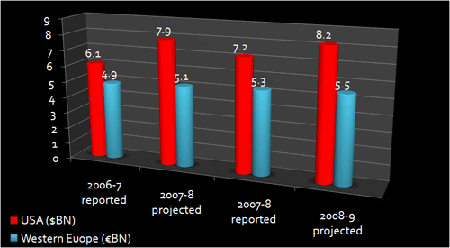

The value of investment chart is based on the aggregated reported investment by owners and operators for the 12 months prior to an event and the investment projected for the following 12 months. It is thus more of a 'rolling' figure than a fixed amount for each calendar year. Note that the European data is shown in Ôé¼ and the American data in $US. The American figures indicate a marked increase between 2006 and 2007 but that actual spending in 2007-8 is marginally lower than projected in 2007. Further increase is expected into 2008-9. Western European investment is far flatter at around Ôé¼5 billion. It also however is projected to remain stable into 2009.