
Last month, data center monitoring tools provider Power Assure unveiled its EM/5 monitoring service, demonstrating how process automation could be used to switch off under-utilized servers and power them back up when conditions warrant.
At that time the company also began delivering a plug-in to the front console of service management platform ServiceNow so that agents and administrators monitoring service levels and customer interactions could also see how those factors are impacting, and being impacted by, power consumption.
ServiceNow had a suggestion, which Power Assure’s CEO Pete Malcolm took note of: What if monitors could also see application performance levels on the same console? APM is not particularly within Power Assure’s wheelhouse.
But the company gave it a try, rolling out an update to EM/5 customers that gives them the option of monitoring any active applications its servers are dishing out at the time.
Malcolm told FOCUS that on-demand APM does not have to be as sophisticated as software developers might require for it to be useful to service managers.
“This is not about testing your applications, as many APM tools do, and seeing how high its load can go. This is about live monitoring, to let you know when things are not going as they should,” Malcolm said.
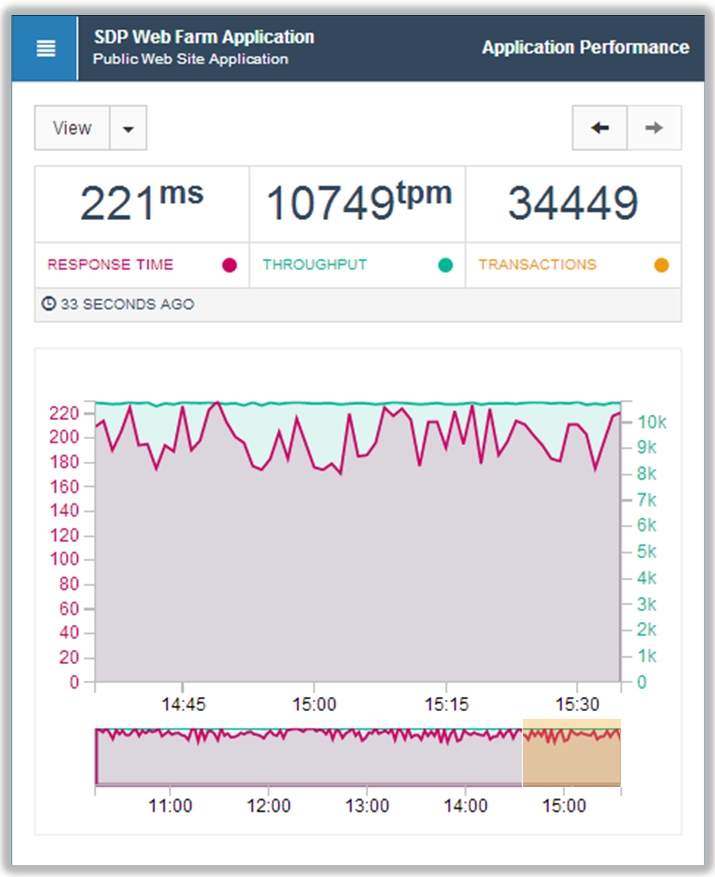
EM/5’s new APM measures for three key metrics: response time to user interactions, throughput expressed in transactions per minute, and the total accumulated number of transactions for any given time period. When Oracle unveiled version enhancements to its 12c database last Tuesday, in an effort to show orders of magnitude speed improvement, one of the functions it demonstrated to its audience was a query that was essentially acting as an APM — doing basically the same work EM/5 now does in conjunction with ServiceNow, except without the addition of a new data warehouse.
Malcolm said the APM tool can be set up to query the log file periodically to determine the changes in any given interval of time. It can also perform a live query from any location in the network, measure the response time and then compare the response times from different locations.
Veteran APM tools providers like to have customers imagine network service operators in grand control rooms, like nuclear power stations, stacked with more active monitors than one of J. J. Abrams’ nightmares. Power Assure’s Malcolm argued that a simpler approach is better.
“Having 50 screens to monitor all of these different tools doesn’t work. They want one tool, perhaps not at the same level of depth, but where they can see the things that really matter, the key metrics, which, from what customers have told us so far, are the three I described,” Malcolm said.
“Now, they might want another tool if they want to dig deeper. But they want one place, one screen where they get alerted to these.”
Most 'dashboard-style' measurement tools and analytics systems use a red/yellow/green scale for depicting when monitored levels are drifting past nominal into critical status.
But exactly what would these levels be, relative to a SaaS (Software-as-a-Service) application you’re serving to clients? You’d have to have monitored service levels for enough time to have calculated the meaning of 'normal.'
“What you want to know is, when is it an abnormal operation?” Malcolm said.
“So with our alerting system, yes, you can set absolute numbers, but you can also aggregate data mathematically, using any relationship you want.” For example, you can set “normal” to be a simple formula — a ratio between the number of active transactions, and the response time. This way, you can account for the shifts in seasonality for traffic patterns over days or weeks.
“It was relatively straightforward for us to do this; because of the way we designed EM/5,” Malcolm said, “it was pretty simple to add this capability in there, and will be for additional types of metrics like security. You can expect those to be added in the future.”