
In just a few years our industry has embraced Power Useage Effectiveness (PUE) as the measure of efficiency for the mechanical and electrical infrastructure of the data center. The process of measuring and reporting has provided a focus and comparable measure of performance that has kick-started a behavioral change that has impacted our entire industry, operators, vendors and consultants.
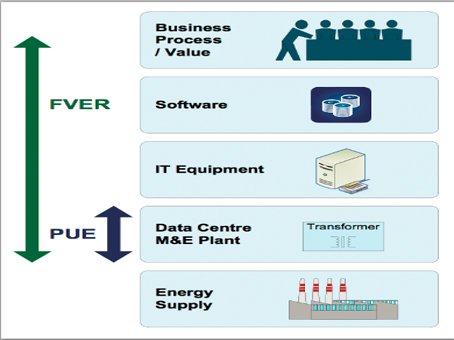
Despite the success of PUE and a great deal of work internationally we have still not taken the expected step to a commonly accepted metric for IT or software efficiency. Many energy efficiency programs stop at the IT power cord, leaving a substantial opportunity untapped or at least unmeasured.
A simple yet relevant and easily applicable productivity metric is the holy grail of the industry at the moment and is of particular interest to bodies whose job it is to set policy, legislation or regulate industry sectors. Given the regulatory interest, it is important that any metric be fair to different types of operator and create more positive than perverse incentives.
Many proposals have been made for data center ‘productivity’ metric. Each of these work well in specific cases but each has run aground on some common issues when assessed for the market as a whole;
• Measuring IT work leaves out the software (in)efficiency and moves the PUE problem only one step up the stack
• Businesses do not generally care about IT work, they care about delivered IT services which support business activities
• The more “accurate” metrics have been challenged by data collection and reporting complexity whilst the easier -to-measure metrics have been weaker indicators and applicable to fewer operators
• Useful work is subjective, what is useful and what value of useful to attach to each action depends on the business of the operator and even this changes over time
• All metrics will be gamed and abused, however, any metric measuring productivity requires operator-specific factors and faces the choice of being rigid and unfair or flexible and easily gamed
Measuring something beyond PUE
The Data Center Fixed to Variable Energy Ratio metric (DC FVER) measures for the first time what proportion of data center energy consumption is variable, i.e. related to the useful work delivered, versus what proportion is fixed allowing operators to understand how much of their energy cost is related to the work delivered and how much is a fixed burden to be targeted for reduction or elimination.
FVER addresses many of the issues above by including the IT equipment and software in the data center efficiency measurement while allowing each operator to select a productivity measure which usefully represents their data center and speaks to business value. This approach removes the issue of trying to define a single productivity metric which can be applied equally and fairly to all data center operators.
FVER lets you do to software and IT what you did to data center infrastructure with PUE, drive out the fat.
DC FVER is calculated using the simple formula below:

Like PUE, FVER scores can vary between 1 and infinity, with the ideal target value being 1. Just as a true PUE measurement of 1.00 is unobtainable in practical terms, a DC FVER score of 1 is also unlikely to be achieved due to the fixed losses within most devices. However, as proven by PUE, the very act of measuring and tracking a metric is a proven way to identify opportunity and change behaviour.
Targeting the Waste!
To use an automotive comparison, our vehicle may be able to carry four passengers on the freeway and achieve some value of MPG. What MPG is good depends on the type of vehicle. What is more important to us is what happens when the vehicle is stationary, when we would expect it to use little or no fuel. Given this, it is somewhat surprising that we are happy to allow our data centers to use almost the same amount of electricity when doing nothing as when delivering full “useful work” output.
A major part of the potential efficiency improvement in the data center is now locked up in the fixed ‘base-load’ power draw. Correcting this issue should be the next priority for data center operators and the wider industry.
In an ideal data center, whatever the power draw, when the IT platforms are at peak load it would be zero when the IT platforms are delivering no services. The DC FVER metric provides a way for operators to measure how well their IT and site energy consumption tracks the useful work delivered by their IT platforms as illustrated below.

Measuring Useful Work
FVER does not prescribe how each data center operator should measure the output of their data center. The same measure is not likely be effective for a supercomputer, a trading site and a web video operator. FVER instead allows each operator to select an appropriate and practical set of proxy measures for useful work, which are meaningful to their business activity. These are then normalized and combined with existing PUE measurements of IT energy and total utility energy to allow for a comparable measure of data center performance.
Reducing the fixed energy consumption is of value to both enterprise operators with variable loads and cloud operators with more constant loads as, similar to PUE, elimination of fixed energy consumption improves both overall and low load efficiency.
Choosing a useful work metric is a process of looking at what your data center does, for example video streaming, HPC, enterprise applications, and which of these support business value.
The Green Grid amongst others has described a number of productivity proxies which may be suitable. The important aspect for calculating your FVER is to pick measures that are relevant to your business.
A very simple example
Let’s take a 1.5MW data center whose primary function is a set of web facing services that our business provides. Of course, we already measure the PUE of our data center so to measure the FVER we would:
1 Select a simple and easy-to-capture useful work metric that relates to the data center’s output (we might choose customer-transactions-per-hour for example)
2 Record work output and power consumption every hour for a week
3 Choose the highest and lowest hours in terms of work output and look at the corresponding hour’s energy consumption (for example):
a. Highest hour was 3pm to 4pm on Thursday, energy consumed was 1.2MWh
b. Worst hour was 3am to 4am on Sunday, energy consumed was 1.0MWh – productivity was close to zero
We can see in this very simple example the energy variability between peak work output and the lowest point of work output equates to 0.2MWh. To calculate our FVER we’d use the following calculation:

I could now, for example, review power management on my IT devices and then re-measure my FVER and clearly see what improvement I’d made.
Summary
DC FVER is by no means a perfect or complete solution. I do believe it provides a simple and immediately measureable metric that will have relevance and value to our industry and the businesses we support.
Most importantly I hope FVER starts to drive the same behavioral change that PUE did in terms of targeting the waste not doing useful work yet costing us all money!
The BCS Data Center Specialist Group would welcome any feedback and as more operators learn about FVER and promise to measure it and feedback we will publish the findings along with any improvements that are suggested or made.
Clearly the example used above is very simple. Try measuring FVER yourself, perhaps before and after a change to see if you improved your energy consumption.
To take a look at the detailed white paper published by the BCS Data Center Specialist Group visit http://dcsg.bcs.org/data-centre-fixed-variable-energy-ratio-metric-dc-fver.
This article first appeared in FOCUS Issue 23. To sign up for digital editions, click here.