
Based on Carbon Intelligence research, over 80 percent of a company’s emissions are Scope 3. But for data centers, this is harder to assess. This is partly because data centers are energy intensive, and energy is largely Scope 2.
DCD>Talks demystifying Scope 3 with Adam Compton, Schneider Electric
DCD's Dan Loosemore and Schneider's Adam Compton sit down to discuss the approaches to Scope 3 emissions
If a data center’s energy has a high carbon-intensity, then Scope 3 will be a smaller percentage of the data center’s overall carbon footprint, and vice versa. But Scope 2 is easier to calculate compared to Scope 3, which makes calculating the total carbon footprint over the lifetime of the data center somewhat of a mystery.
Although reporting on Scope 3 emissions is not a mandatory requirement yet, it is beneficial for data center operators to understand the major drivers of Scope 3 emissions.
As the management guru Peter Drucker said, “If you can’t measure it, you can’t manage it.” In other words, you can’t fix what you can’t measure.
Understanding Scope 3 emissions is a key step for data center operators to prioritize carbon-reduction efforts to achieve their environmental sustainability ambitions. Scope 3 will be the next frontier in key performance indicators for the data center industry.
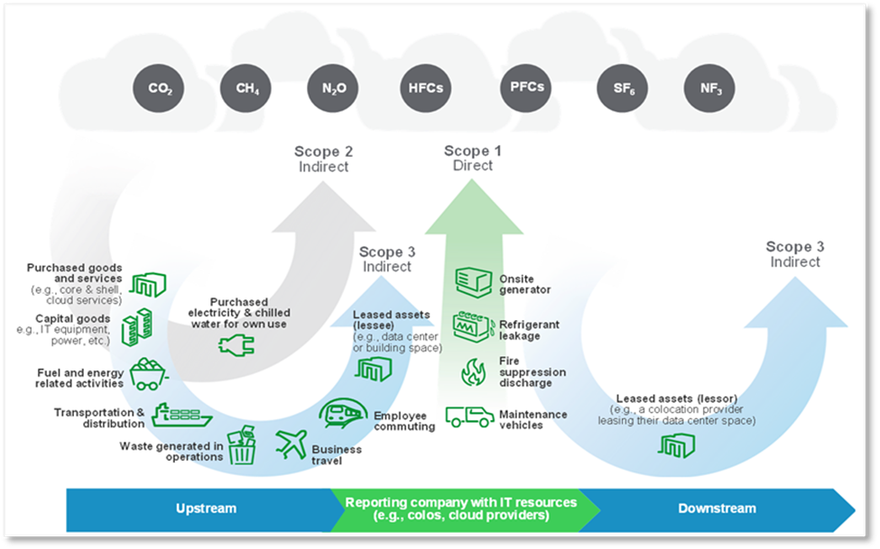
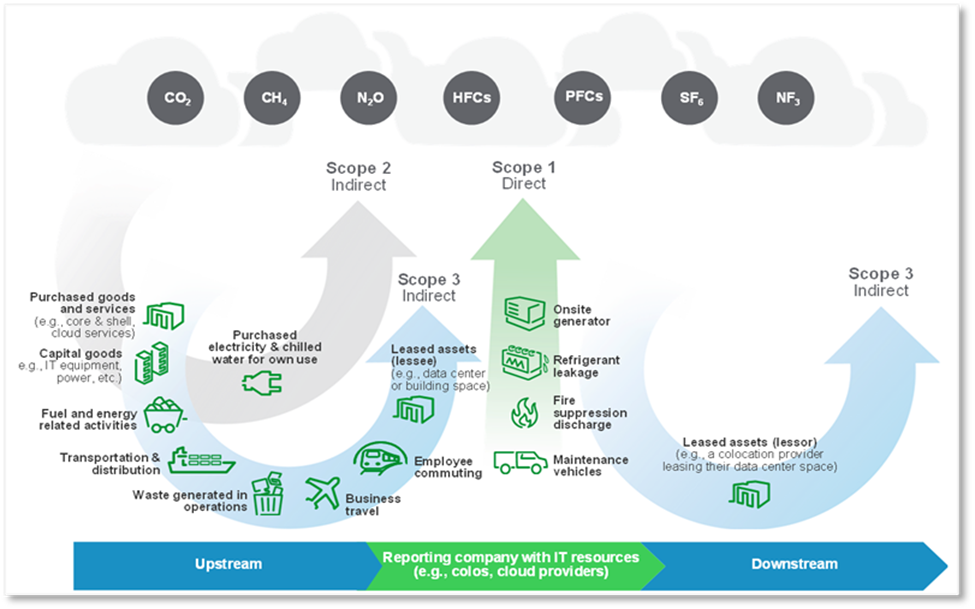
Scope 3 emissions are by far the most challenging to report
Scope 3 includes all indirect emissions from sources such as purchased goods and services (e.g., data center construction); capital goods (e.g., computers, power systems, cooling systems); business travel (flight, train, rental cars, hotels, etc.); employee commuting (cars, buses, etc.); and waste management (E-waste, batteries) across a data center organization’s value chain.
Quantifying and reporting on Scope 3 presents a significant challenge for data center operators. This is mainly due to a lack of three resources:
- Reliable supplier data
- Quantitative tools
- Accounting and reporting methodology.
After half a year of research, we released White Paper #53, Recommended inventory for data center Scope 3 GHG emissions reporting. This inventory includes nine emission source categories and their data center specific subcategories as a framework for data center operators to account for and report their Scope 3 emissions. We then began researching and collecting data to develop tools.
The first comprehensive attempt to quantify data center Scope 3
Quantifying Data Center Scope 3 GHG Emissions to Prioritize Reduction Efforts
Supporting your transition to renewable energy
Robert Bunger, Victor Avelar and I have developed a new White Paper #99, Quantifying data center Scope 3 GHG emissions to prioritize reduction efforts.
In this newly released paper, we use a single hypothetical data center to demonstrate how to quantify Scope 3 emissions and identify the largest emission sources.
We also developed a calculator titled, Data Center Lifecycle CO2e Calculator, which can be used to estimate a data center’s lifecycle carbon footprint.
Carbon emissions vary significantly depending on many factors including data center size, redundancy level, electricity emission factor, core & shell construction, IT equipment configuration, energy efficiency, equipment lifespan & replacement frequency, value chain activities, etc.
Our intent is to provide a baseline and an educational tool to advance Scope 3 accounting, reporting, benchmarking, and management for the data center industry.
Key assumptions of our hypothetical data center
Our model assumes an on-premise data center to isolate the quantification of its carbon footprint, allowing us to ignore colo and cloud services. Other assumptions include: 1MW IT capacity, Tier 3, 50 percent loaded; 1.34 PUE; 6 kW/rack, N+1 power and chilled water cooling; VRLA batteries replacement every four years; IT equipment refresh every four years; 511 kg CO2e/MWh average US electricity emission factor.
Key insights from our study
We broke out carbon footprint by Scope, GHG source category, lifecycle phase, and data center subsystem to identify the largest emission sources. We found that:
Recommended Inventory for Data Center Scope 3 GHG Emissions Reporting
Your guide to quantifying Scope 3 emissions to ensure you're measuring your organizations total carbon footprint, including outsourced IT services from cloud and colocation service providers
- Depending on the carbon intensity of purchased electricity, Scope 3 emissions can be the largest contributor to total carbon footprint.
- Capital goods are the largest driver of embodied carbon.
- The composition of Scope 1, 2, and 3 varies throughout the lifetime of a data center. Scope 1 emissions represent a small percentage (0.2-0.5 percent) of the total carbon footprint while Scope 2 emissions represent 31-61 percent. Scope 3 emissions represent 38-69 percent of total carbon footprint. However, as the data center uses more renewable energy, the Scope 2 emissions percentage decreases.
- The total cumulative carbon footprint of a data center increases year over year due to continuous fuel (diesel) combustion, energy consumption, and value chain activities.
- The core and shell of the data center building represents only about 6.6 percent of total Scope 3 emissions before power is turned on (i.e., start of year one – embodied carbon only.)
Seven proposed Scope 3 carbon-reduction actions
With the Data Center Lifecycle CO2e Calculator, data center operators can make better informed decisions in site selection, design choices, construction, operation, and maintenance to minimize Scope 3 emissions. We recommend the following seven actions to reduce Scope 3 emissions based on our findings:
- Use more renewable/clean energy: This is a significant lever in reducing the emissions from Scope 3 GHG Category 3 – fuel and energy-related activities. There are organizations that help data centers increase their renewable energy mix such as Neo Network.
- Extend server lifespans: Our study shows that if we extend the server’s lifespan an extra year, we can reduce the cumulative data center embodied carbon by about 16 percent. However, we need to note that server replacement must be weighed against performance and energy efficiency gains of newer IT equipment to minimize the sum of embodied carbon and energy-related carbon emissions.
- Purchase efficient and low carbon products: Products should be low in embodied carbon, energy-efficient, and have good circular economy properties like durability and recyclability. Specifying products based on embodied carbon is critical to minimizing a data center’s carbon footprint.
- Reuse existing building for data centers instead of new construction: This is an effective way for data center operators to minimize this environmental impact. Research from Serverfarm shows that, “Modernization of data centers, which reuses existing buildings while expanding capacity, can deliver embodied carbon savings of 88 percent when compared with the material carbon cost of new projects.”
- Evaluate modular and prefabricated construction methods: Although we haven’t performed a quantified environmental analysis between modular prefabricated solutions vs. 100 percent stick-built construction, we’re optimistic implementing prefabricated solutions will have lower embodied carbon.
- Design and operate for high utilization from IT to the facility: The more you can load an existing data center, the more you can delay data center expansion, which will lower your overall Scope 3 emissions. This includes monitoring and improving server utilization, designing for higher facility utilization and higher rack density, and reducing stranded capacity.
- Optimize IT demand: The lowest carbon data center is the one you don’t have to build. In other words, optimizing IT demand to avoid over-building plays an important role in data center carbon reduction.
More and more data center operators are making Scope 3 carbon reductions a priority. We recommend that they integrate sustainability into their evaluation criteria when selecting data center equipment suppliers and service providers to minimize Scope 3 value chain carbon footprint.
Vendors need to commit to reducing the embodied carbon of their product portfolio. Data center equipment suppliers must make Type III Environmental Product Disclosure (EPD) documents freely available and easily understandable for their products. Learn more about our study in White Paper #99, Quantifying data center Scope 3 GHG emissions to prioritize reduction efforts.
More from Schneider Electric
-

Sponsored Data center sustainability Scope 3 emissions: Expectations versus reality
Scope 3 explained
-
Is the industry ready to make a difference on a Scope 3 level?
Schneider Electric’s Adam Compton explains the different scopes of carbon emissions
-
DCD>Talks Sustainability Metrics with Rob Bunger, program director of the CTO office, Schneider Electric
In this DCD>Talk we discuss how Schneider Electric approaches sustainability metrics with program director of the CTO office Rob Bunger