Predictive analytics company Romonet has launched a free tool which allows data center builders to compare the efficiency, energy cost and emissions of different architectures used in data center construction, across a variety of geographic conditions.
The Site Analysis Tool on the Romonet site allows businesses to compare designs and locations, so they can choose the best options for their data centers. It includes some 69 locations in North America and 22 in Europe (with more to follow), calculating the efficiency, costs and emissions over a full year, using Romonet’s analytics software and published data on power costs and the mix of sources on local energy grids.
What should I do?
“We have clients in all parts of the planet, who ask us for the best data center design depending on where they are,” Romonet’s founder Zahl Limbuwala told DCD. Romonet procured a similar tool for an American data center builder a few years back, which used static data to suggest a cooling design for any location in the US. The new tool uses information which will be updated and opens up acess to everyone, he said.
Across all the regions, and the four major data center designs it covers, the tool gives access to around 1,600 simulation-years of data processed by Romonet’s algorithms, and data for a year of typical weather in each location. The results are added up to give a full-year value and annual performance figures.
The tool lets users compare the energy, PUE (power usage effectiveness), cost and CO2 emissions of each design.
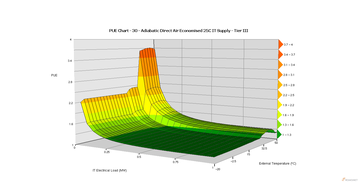
During a demonstration of the tool, Limbuwala showed some interesting features - for instance, on a site using adiabatic direct air economization, power consumption will go up (resulting in higher PUE) above a certain ambient temperature, as the DX cooling system would have to be switched on (see diagram).
”There are many other factors involved in site selection,” said Limbuwala. “Some are beyond simple metrics, and we’re not plannign to expand for those factors. We can add anything that can be quantitavely analyzed.”
The tool is “as close as you can get to an apples-for-apples comparison,” he said. “All the sites are 1MW, and they are all at the same resilience level.”
The tool will be expanded during the summer, with new locations, outside Europe and North America, and also with the adddition of a metric for water usage in the data center.
The results can be downloaded, as can much of the underlying data, said Limbuwala.

