
Track what's being built, and where, globally
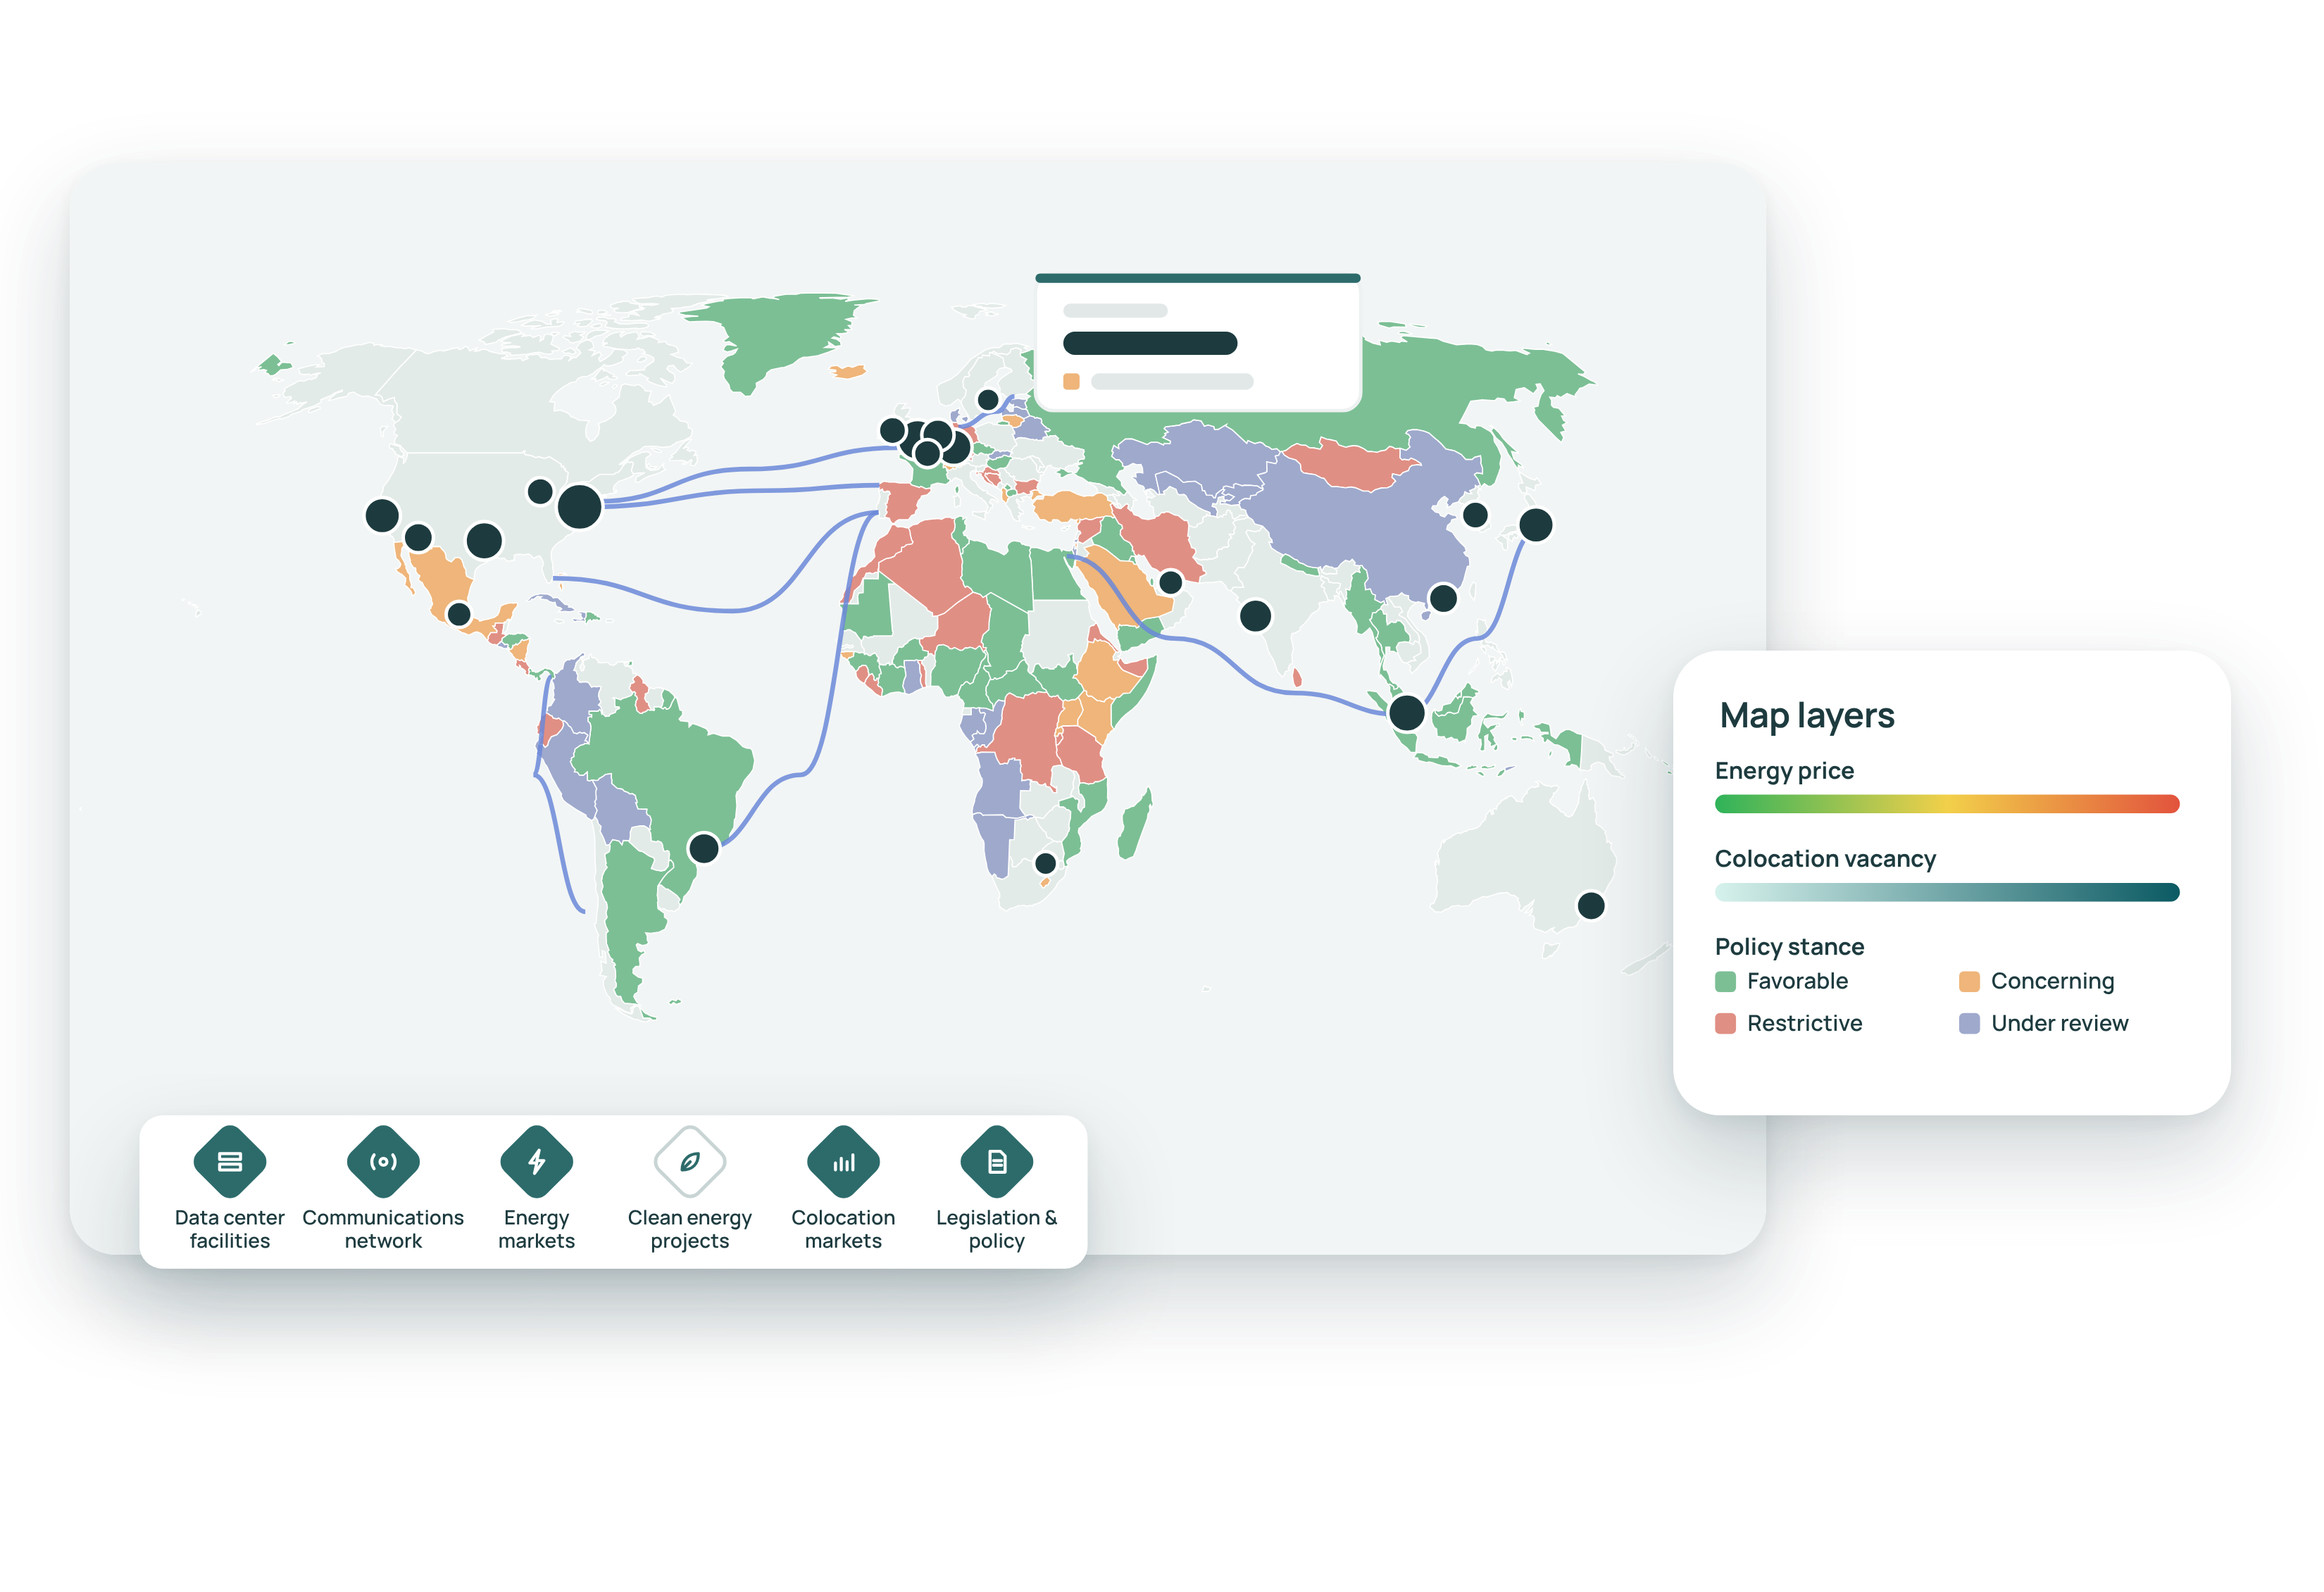
Explore more than 10,000 data center facilities on one interactive map, and overlay the energy, network, market and policy data that shape where the industry builds next
Request a demo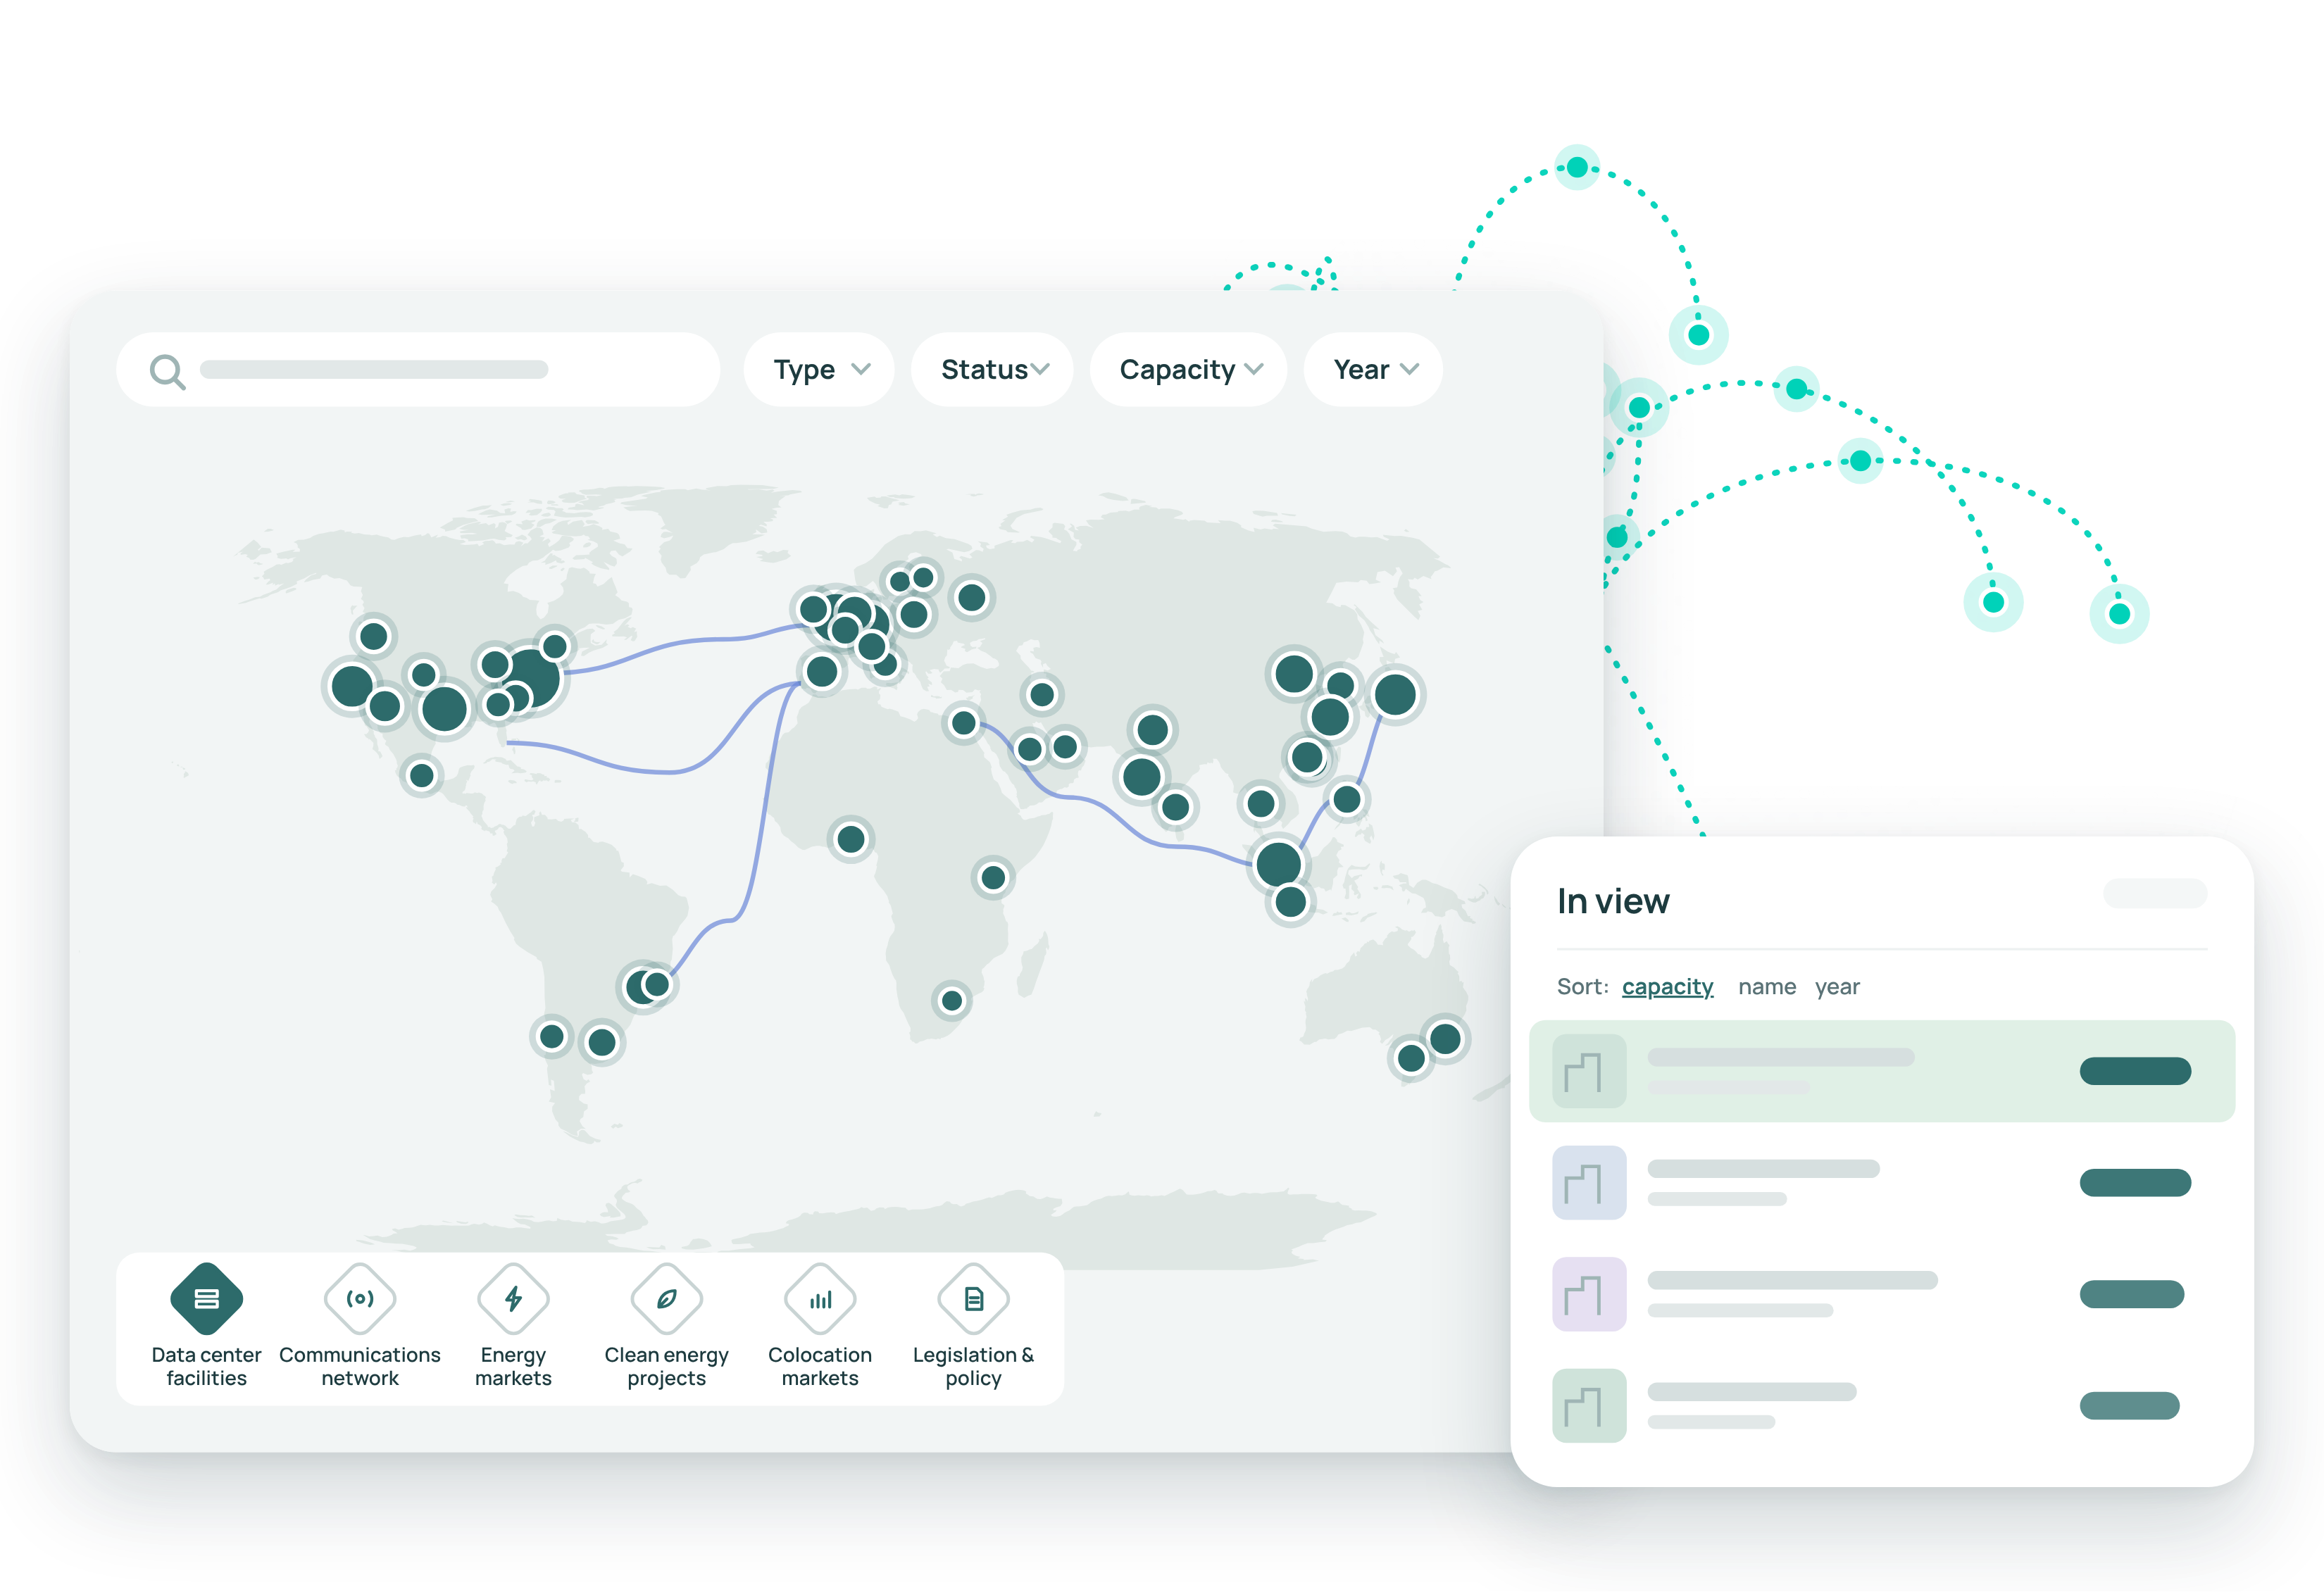
Built in partnership with





Explore every facility in detail worldwide
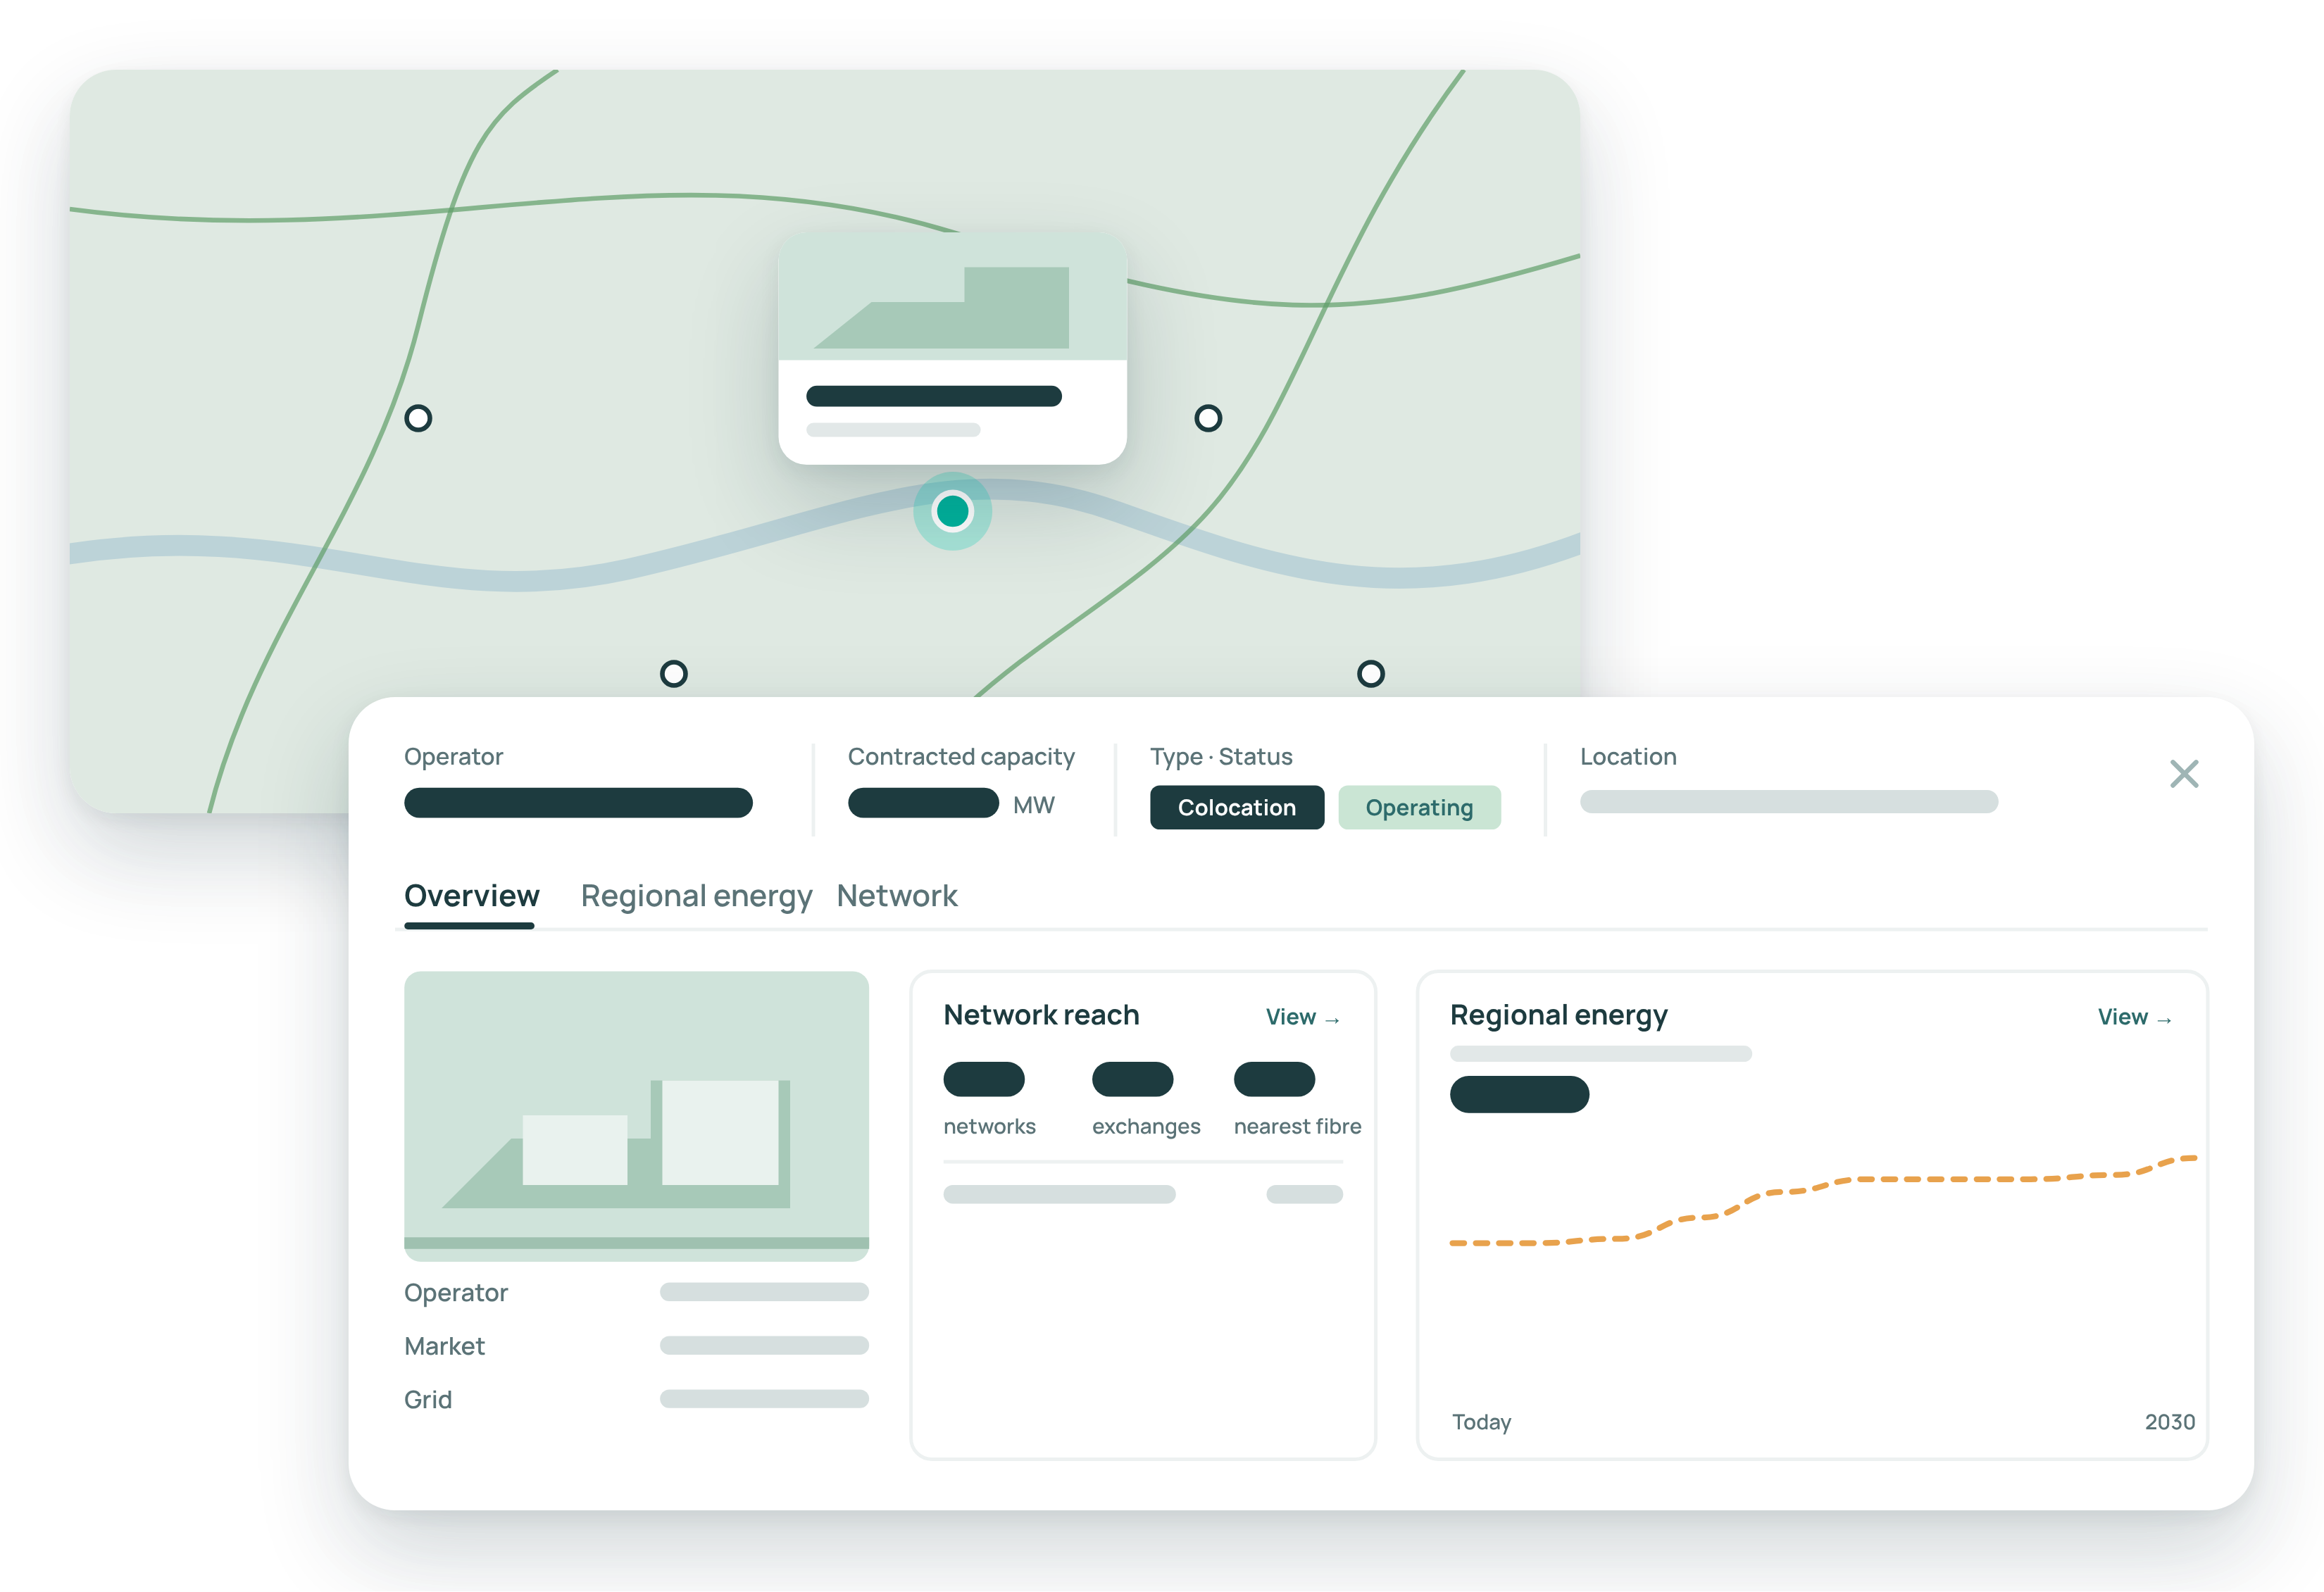
Search and filter data center facilities by type, status, capacity and year, then click into any site to see its operator, contracted capacity, white space, and cooling and power redundancy.
Each facility links to the network and regional energy data around it, including power market projections, so you can understand every site in its full context.
Overlay the site selection and investment criteria that matter
Layer the energy, network and market data behind every siting decision, and compare locations side by side.
See energy prices, subsea and long-haul networks, internet exchanges, clean energy projects and colocation vacancy on the same map as the facilities themselves.
Overlays draw on our data partners, including AFRY Management Consulting, Cleanview and CBRE, alongside DCD's own research.
Understand the policy landscape
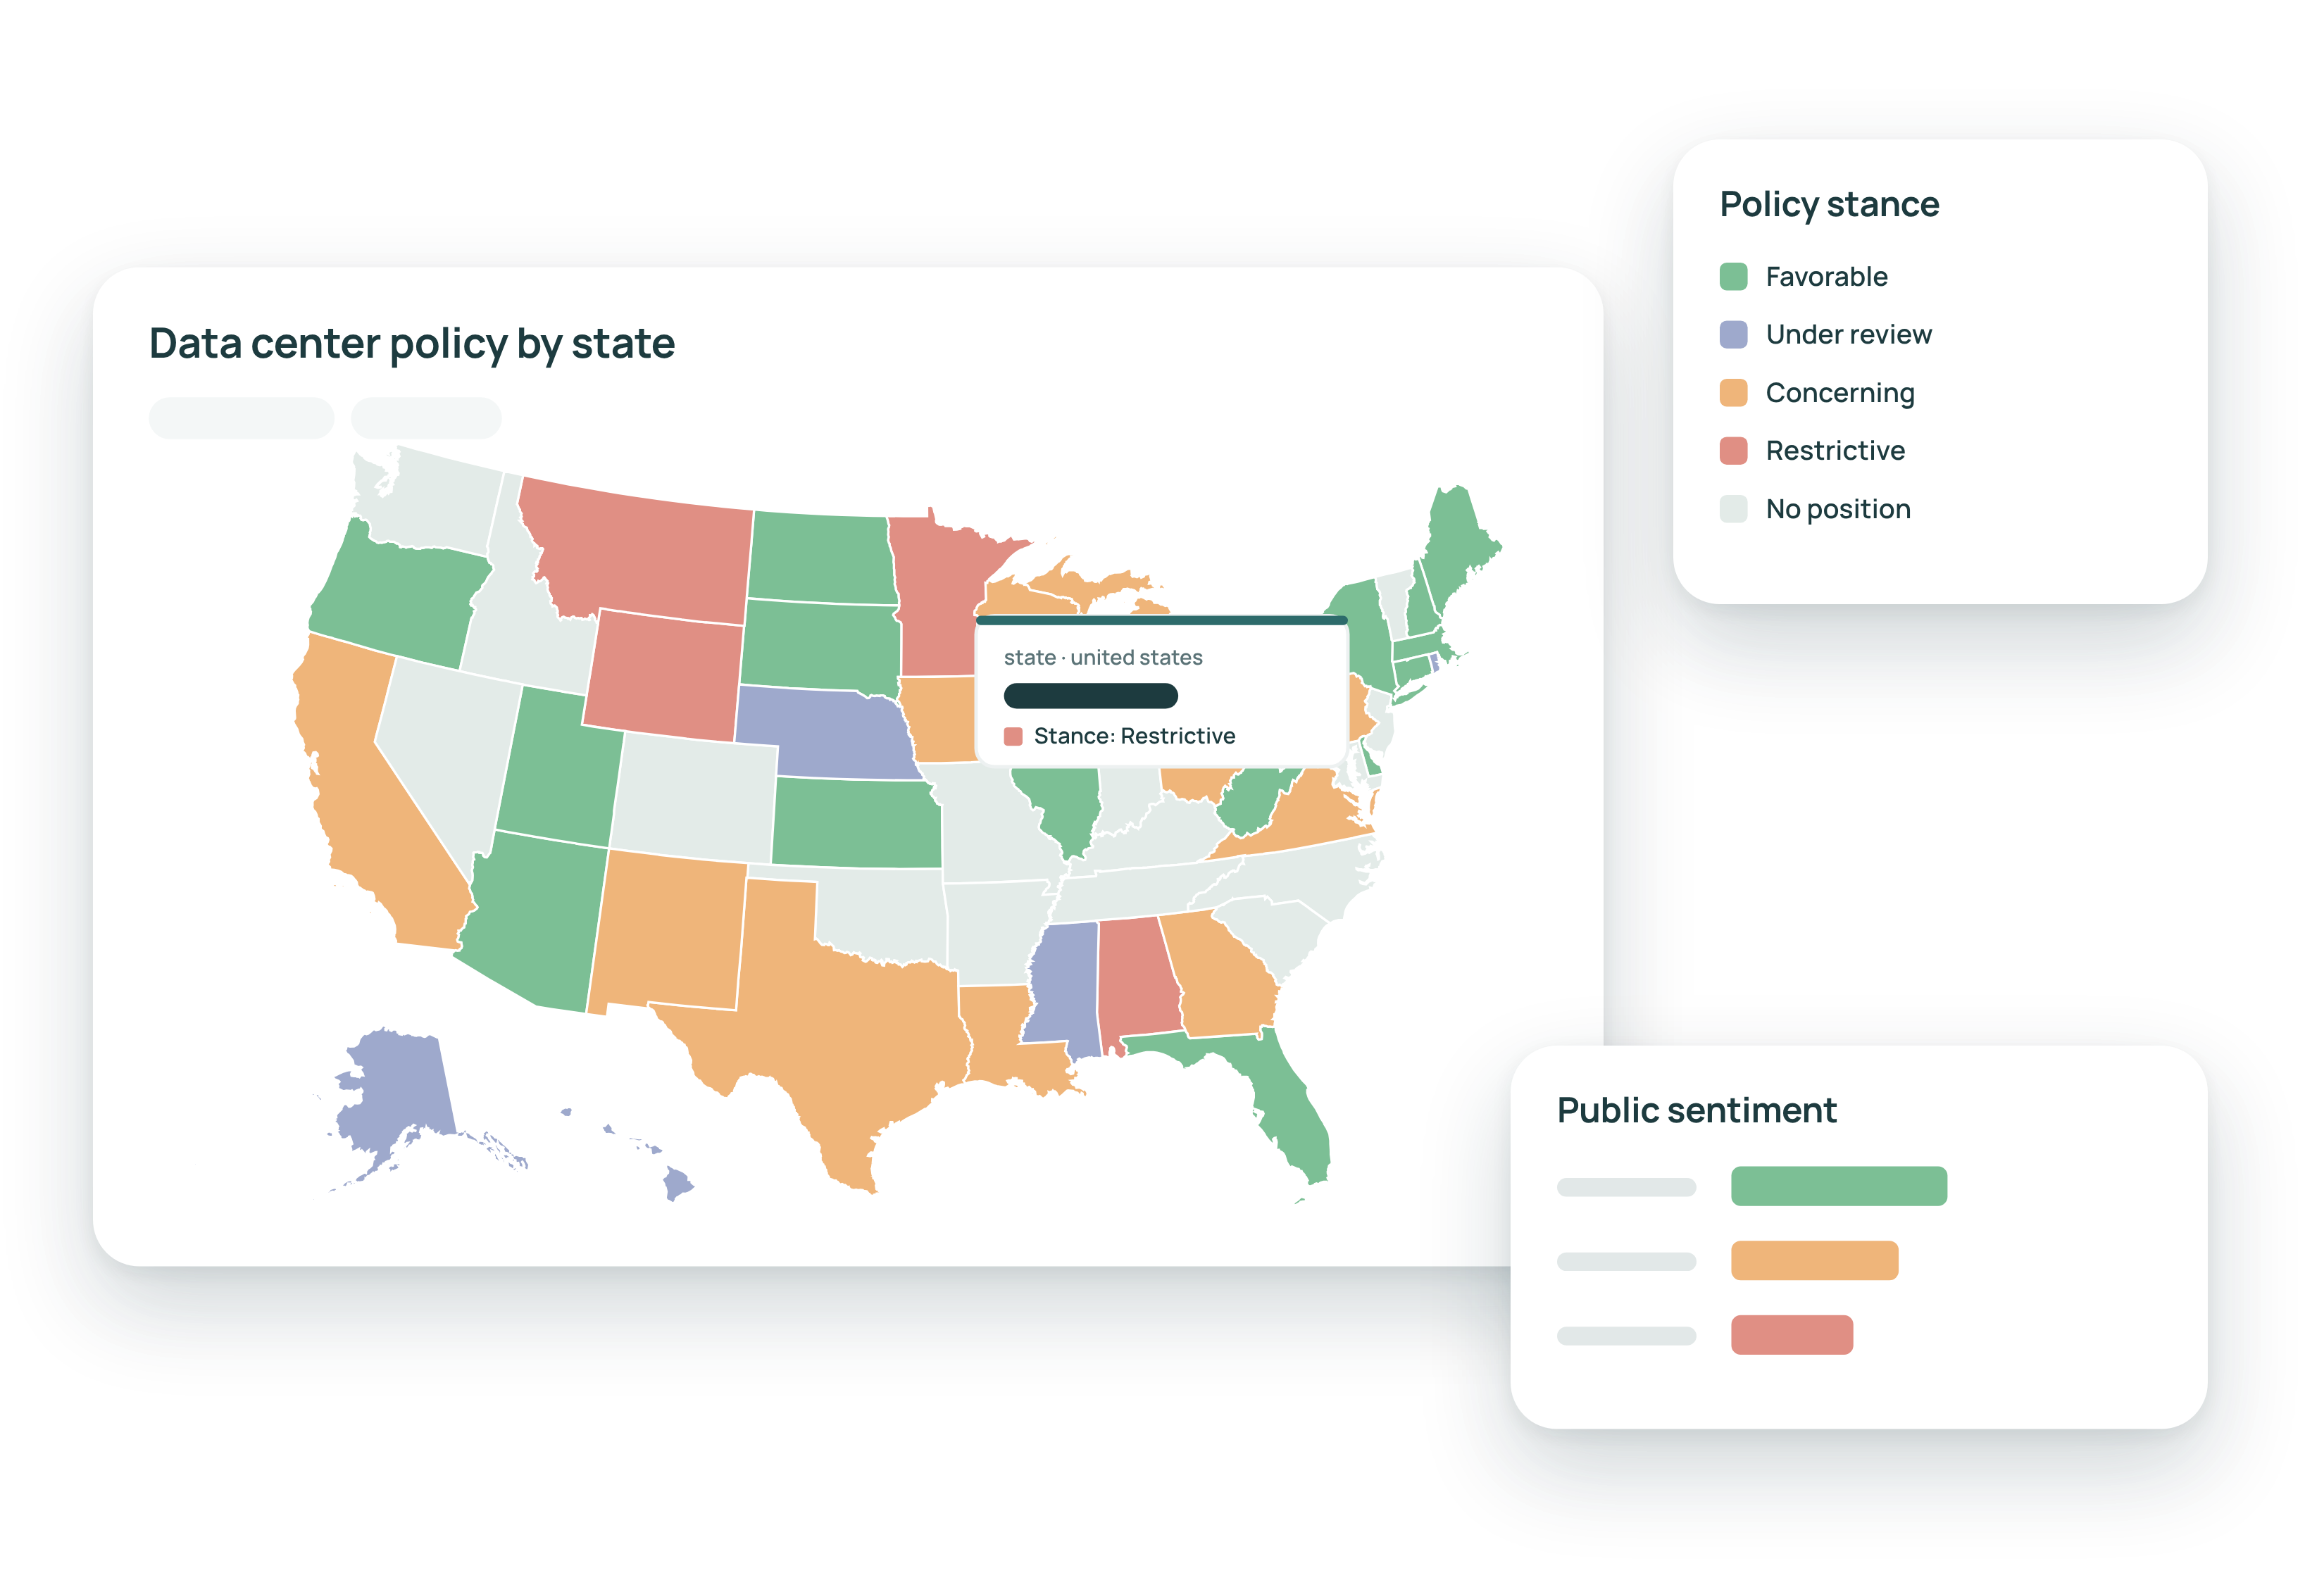
Where you can build depends on more than power and land. See how welcoming each market is to new data center development.
Track data center legislation, incentives and moratoriums alongside public sentiment, by country and by US state.
Spot shifting policy early, before it changes the economics of a site.
Why DCD Intelligence

Built and maintained by DCD Research
Our facility dataset is researched and updated by DCD's in-house team, drawing on 26 years of covering the industry, and operators can validate their own facility records.

Every site selection factor in one place
Facilities, power markets, networks, clean energy, colocation markets and policy sit on one map, so you don't have to piece together multiple sources.

From facility to forecast
Click from any site into regional energy projections, market forecasts and analyst reports to see how a location is likely to evolve. The platform is updated live, so as we learn about new projects, so do you.
Request a platform demo
Fill out the form below to book a tailored walkthrough of the live platform with our team.