
A few years ago, a couple of colleagues and I founded a company to develop high performance telecommunications switches. After the second round of funding we recruited a CFO. Even though he had only superficial knowledge of IT he was considered a safe pair of hands and was given the task of supervising our small but important IT group. Unfortunately he relied too much on reports and consultants to manage the operation.
After a couple of weeks, disaster struck. Our development environment went off line for two days just before a critical engineering milestone. Apparently a consultant with doubtful expertise had reconfigured the network. At that point the IT operation was returned to the engineering management.
My cousin, who had been a CFO, was assigned to supervise the IT operation of a large hotel chain. When he took over, he got down and dirty, spending weeks visiting suppliers with key staff members and getting briefed on the issues. He remained there until he was again promoted.

Avoid hands-off management
One very common issue in data center decision making is that of the uninvolved senior management being ill-advised by entrenched data center managers about the adoption of liquid cooling to replace existing air based systems. You will more often than not hear the claim that “liquid cooling is too expensive” or “risky”. While that may have been true for earlier generations of liquid cooling, when systems were rudimentary and water chemistry was not well understood, it is certainly not true today. Properly engineered liquid cooling systems available now have lower capital costs and TCO than air.
Happily, a few companies are starting to understand the benefits of liquid cooling. These include:
- tenfold increase in density
- much less energy required for cooling
- less time to production and return on capital
- no need for a custom building
- increased reliability
- cooling high power chips
- no need for re-characterizing air flows prior to moves, adds or changes and
- a much improved work environment.
Rather than resort to hand waving, we’ll analyze some scenarios using a widely available web based data center cost estimator to substantiate our claim. Here are scenarios involving standard air-cooled equipment and Aquarius [a water-cooled system from Clustered Systems - Editor]:
- 1MW air cooled with 5kW racks, about 140W per square foot. It uses peripheral cooling in conjunction with a chiller and CRACs with variable frequency drive motors. This is typical of most existing data centers
- 1MW air cooled with 20kW racks, about 356 W per square foot. It has hot aisle isolation and a chiller and economizer with CRACs and VFDs. This is generally accepted as the maximum economically feasible air cooling capability.
- 1MW water cooled Aquarius system with 43kW racks (400W servers) , about 1700 W/sq. ft. It is sufficient to allocate just enough space for servicing, typically 25 sq. ft. per rack.
- 800kW Aquarius system as 3) above but with the same number of servers as the air cooled cases 1) and 2).
A 1U pizza box containing two servers is a fairly typical configuration for an air cooled setup. This platform is used in cases 1 and 2. Sticker wall socket power consumption, used to compute worst case IT load is around 1,000W per box. The two baseboards take 400W each and the fans, at full speed, 200W (20% of the total).
For many years the industry pretended that the fan load was part of IT load, not cooling. Further, as the fans rarely run faster than idle, they normally consume less than 60W.
So that’s the first bit of bad news, you’ve just spent 14 percent more on power infrastructure that you’ll almost never use (stranded power).
In the Aquarius rack, servers are housed in individual trays with three per cold plate and a total of 36 cold plates. Each server’s sticker power consumption is 400W. There are no fans, so no stranded power and you get 25% more servers per megawatt!
Here’s how the numbers break down.
| Energy Usage | Air-cooled 5kW | Air-cooled 20kW | Aquila maximum quantity servers | Aquila equivalent quantity |
|---|---|---|---|---|
|
Number of servers |
2,000 |
2,000 |
2,500 |
2,000 |
|
Server power W |
500 |
500 |
400 |
400 |
|
Servers per rack |
10 |
40 |
108 |
108 |
|
Power per rack kW |
5 |
20 |
43.2 |
43.2 |
|
Number of racks |
200 |
50 |
23 |
19 |
|
Sq ft per rack |
35.8 |
56.2 |
25.0 |
25.0 |
|
IT space, sq. ft. |
7,152 |
2,811 |
575 |
475 |
|
Power density W/ft2 |
140 |
356 |
1,739 |
1,684 |
|
Total IT power kW |
1,000 |
1,000 |
1,000 |
800 |
Table 1 Servers and white space requirements
Now you can see the second problem. If you don’t have to get air to your racks, just people to service them, each rack only needs about 25 square feet. But for air, you need wide open spaces, which may be cost effective in the USA (Big Data Center on the Prairie anyone?) but in crowded Europe and Asia, plus big cities worldwide, such spaces rapidly become cost prohibitive, even if they are available. In the first air example, at $250 per square foot construction cost, that’s about $1.7 million extra cost just for the IT floor.
Cut the complexity
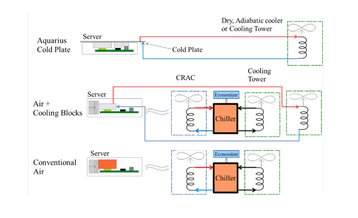
Further bad news for the anti-liquid caucus is the reduced cooling cost and increased flexibility of the newest systems. The “Conventional Air” diagram shows a simple air cooled system with a lot of very expensive cooling equipment. The “Air + Cooling blocks” shows a first generation liquid cooling system (originally designed for gaming machines). You don’t need to be a CFO to realize that two systems can’t be cheaper than one. Yet at least two major OEMs are trying to convince you that it’s the right thing to do.
To eliminate cost you must stick with just one cooling system and make that as cost effective as possible. For this liquid is the natural choice. It is far superior to air for carrying heat away. For water only 1/1000th of the volume is required. Pipes rather than enormous ducts or special buildings are all that is needed.
It’s also pretty clear that the system is much simpler and promises considerable savings over traditional air. In addition, you don’t need a custom building with its accompanying permits and paperwork. A warehouse or decommissioned factory would work just as well and be a lot cheaper. This also reduces the time to see returns on capital invested as simpler systems are faster to build and get into operation.
| Capex | Air-cooled 5kW 2000 servers | Air-cooled 20kW 2000 servers | Aquila 2500 servers | Aquila equivalent 2000 servers |
|---|---|---|---|---|
|
Facility Cost |
$8,173 |
$6,620 |
$3,215 |
$2,796 |
|
Savings |
19% |
61% |
66% |
|
|
IT cost |
$7,910 |
$7,523 |
$9,775 |
$7,820 |
|
Total |
$16,083 |
$14,143 |
$12,990 |
$10,617 |
|
Savings vs 5kW |
12% |
19% |
34% |
Table 2 Capital expense comparison
Table 2 summarizes the cost of building a green field facility. As the calculator we used did not encompass liquid cooling, we pro-rated the electrical costs by assuming the cooling energy overhead of air based facilities to be 50 percent of IT power and that of liquid cooling to be 5 percent.
Overall, the liquid cooled facility costs about one third as much as a traditional low power density facility. However, some of these savings are offset by the additional cost of the Aquarius racks which also carry part of the cooling system. When the cost of the servers and racks are added in the savings still amount to one third the cost of the 5kW rack air facility.
| Amortization | Air-cooled 5kW | Air-cooled 20kW | Aquila 2500 servers | Aquila equivalent 2000 Servers |
|---|---|---|---|---|
|
Power |
$166 |
$164 |
$131 |
$105 |
|
Cooling |
$108 |
$101 |
$40 |
$37 |
|
Other |
$67 |
$45 |
$27 |
$32 |
|
Building |
$78 |
$51 |
$6 |
$5 |
|
Total Amort. |
$419 |
$361 |
$204 |
$178 |
|
Energy |
$1,388 |
$1,219 |
$964 |
$771 |
|
Maintenance |
$485 |
$444 |
$232 |
$189 |
|
TCO |
$2,292 |
$2,024 |
$1,400 |
$1,138 |
|
Savings vs 5kW air |
12% |
39% |
50% |
|
|
Savings vs 20kW air |
31% |
44% |
Table 3 Total cost of ownership comparison
In computing total cost of ownership, amortization rates of 15 years and 39 years were used for equipment and building respectively. Maintenance was computed at 10 percent of the purchase price for all electrical plant and air based cooling systems. Liquid cooling systems maintenance computations used 5 percent of purchase price. Janitorial was prorated to facility size.
Another factor that needs to be considered is the cost of server failures. From our experience, the ExaBlade system [from Clustered Systems] deployed at the SLAC National Accelerator Laboratory (which had zero server failures in over two million hours of operation) and informal data from DoE’s Sandia Laboratory (which has shown a similar reliability result), liquid cooled systems make a 5 percent to 8 percent difference in the overall server failure rate.
Further we were told that an equivalent air cooled system had a 6 percent per year failure rate. For this discussion we used a 5 percent failure rate for air cooled and 1 percent for liquid. This would add approximately $360,000 to the annual TCO of the air cooled systems but only $72,000 for liquid cooled ones.
Lastly, the happiness coefficient of your IT team will improve as they will no longer have to work in extreme temperatures and suffer the deleterious effects of fan noise. This will result in fewer operational errors and reduced staff turnover.
Phil Hughes is CEO of Clustered Systems